


Poster: The Historic Development of Network Visualization
» PDF: Poster 2 x 2 m (78.8 x 78.8 in)
» PDF: Poster 1 x 1 m (39.4 x 39.4 in)
» Image: Bernfeld 1922
» Image: Davis et al., 1941
» Image: Davis et al., 1941 Matrix
» Image: Hobson, 1884
» Image: Lundberg & Steele, 1938
» Image: Macfarlane, 1883
» Image: Moreno, 1934
» Image: Northway, 1940
» Image: Roethlisberger et al., 1939
» Image: Sampson, 1968
» Image: Whyte, 1943
» Image: Metric Development
Reference: Pfeffer J., Freeman L.C. (2019) Social Network Visualization, Methods of. In: Meyers R. (eds) Encyclopedia of Complexity and Systems Science. Springer, Berlin, Heidelberg.
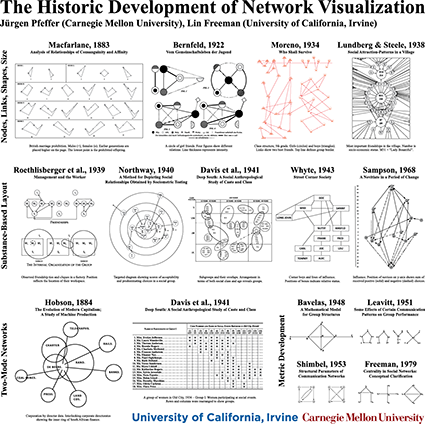
Sunbelt Abstract: Modern network visualization goes back to Jacob L. Moreno’s “Sociograms” of the 1930s. He standardized the usage of circles and lines to represent agents and their relations (1932). He introduced shapes to mark different groups of nodes and used arrow heads to show directionality of connections (1934). Decades before computer programs were available, Moreno positioned the nodes to reveal social structure (1934). In subsequent years, important nodes were arranged centrally in radial layouts (Lundberg and Steele, 1939) or were drawn with larger circles (Loomis, 1946). Contextual information played an ever greater role in network visualizations—Roethlisberger and Dickson (1939) positioned nodes based on their physical location; Davis, Gardner, and Gardner (1941) used socio-economic variables to position the nodes; and Sampson (1968) mapped positive and negative sentiment towards agents to node positions. However, some remarkable network visualizations had already been published as early as the late nineteenth century. These visualizations include Alexander Macfarlane’s visual representation of British marriage prohibitions (1883) and John Hobson’s approach of visualizing two-mode data by showing the overlap of directors among South African companies (1894). For this poster presentation, we have re-created the above mentioned visualizations as well as other historic network figures. All of them represent milestones in the development of network visualizations that guide contemporary network visualizations through today.
